Harlan County Was Never Liberal
Harlan County, Kentucky is shorthand for union coal country: the “Bloody Harlan” mine wars of the 1930s, the Brookside strike filmed in Harlan County, USA (1976), the song “Which Side Are You On?”. For most of the twentieth century it was a Democratic stronghold. Today it is one of the most Republican counties in the United States: Donald Trump won about 88% of its vote in 2024.
The usual story is that a left-leaning place moved right. My hypothesis was different. The Democratic coalition in places like Harlan was held together by material interest (the union, the New Deal, coal jobs) rather than ideological agreement. Culturally, these voters may never have been liberal. When the economic reasons to vote Democratic weakened, and the parties began to divide over cultural issues instead, they voted where their values had always been.
This series tests that idea. This first post looks at Harlan itself: its election history back to 1868, its economy, and what happened to the views of voters like its residents. Later posts look at the voters who sided with the other party on the issues and voted Democratic anyway, at every county that left the Democrats, and at where party loyalty comes from.
Harlan was Republican before it was Democratic
The first surprise is that Harlan was not historically left-leaning at all. It was a Republican county for sixty years before the New Deal.
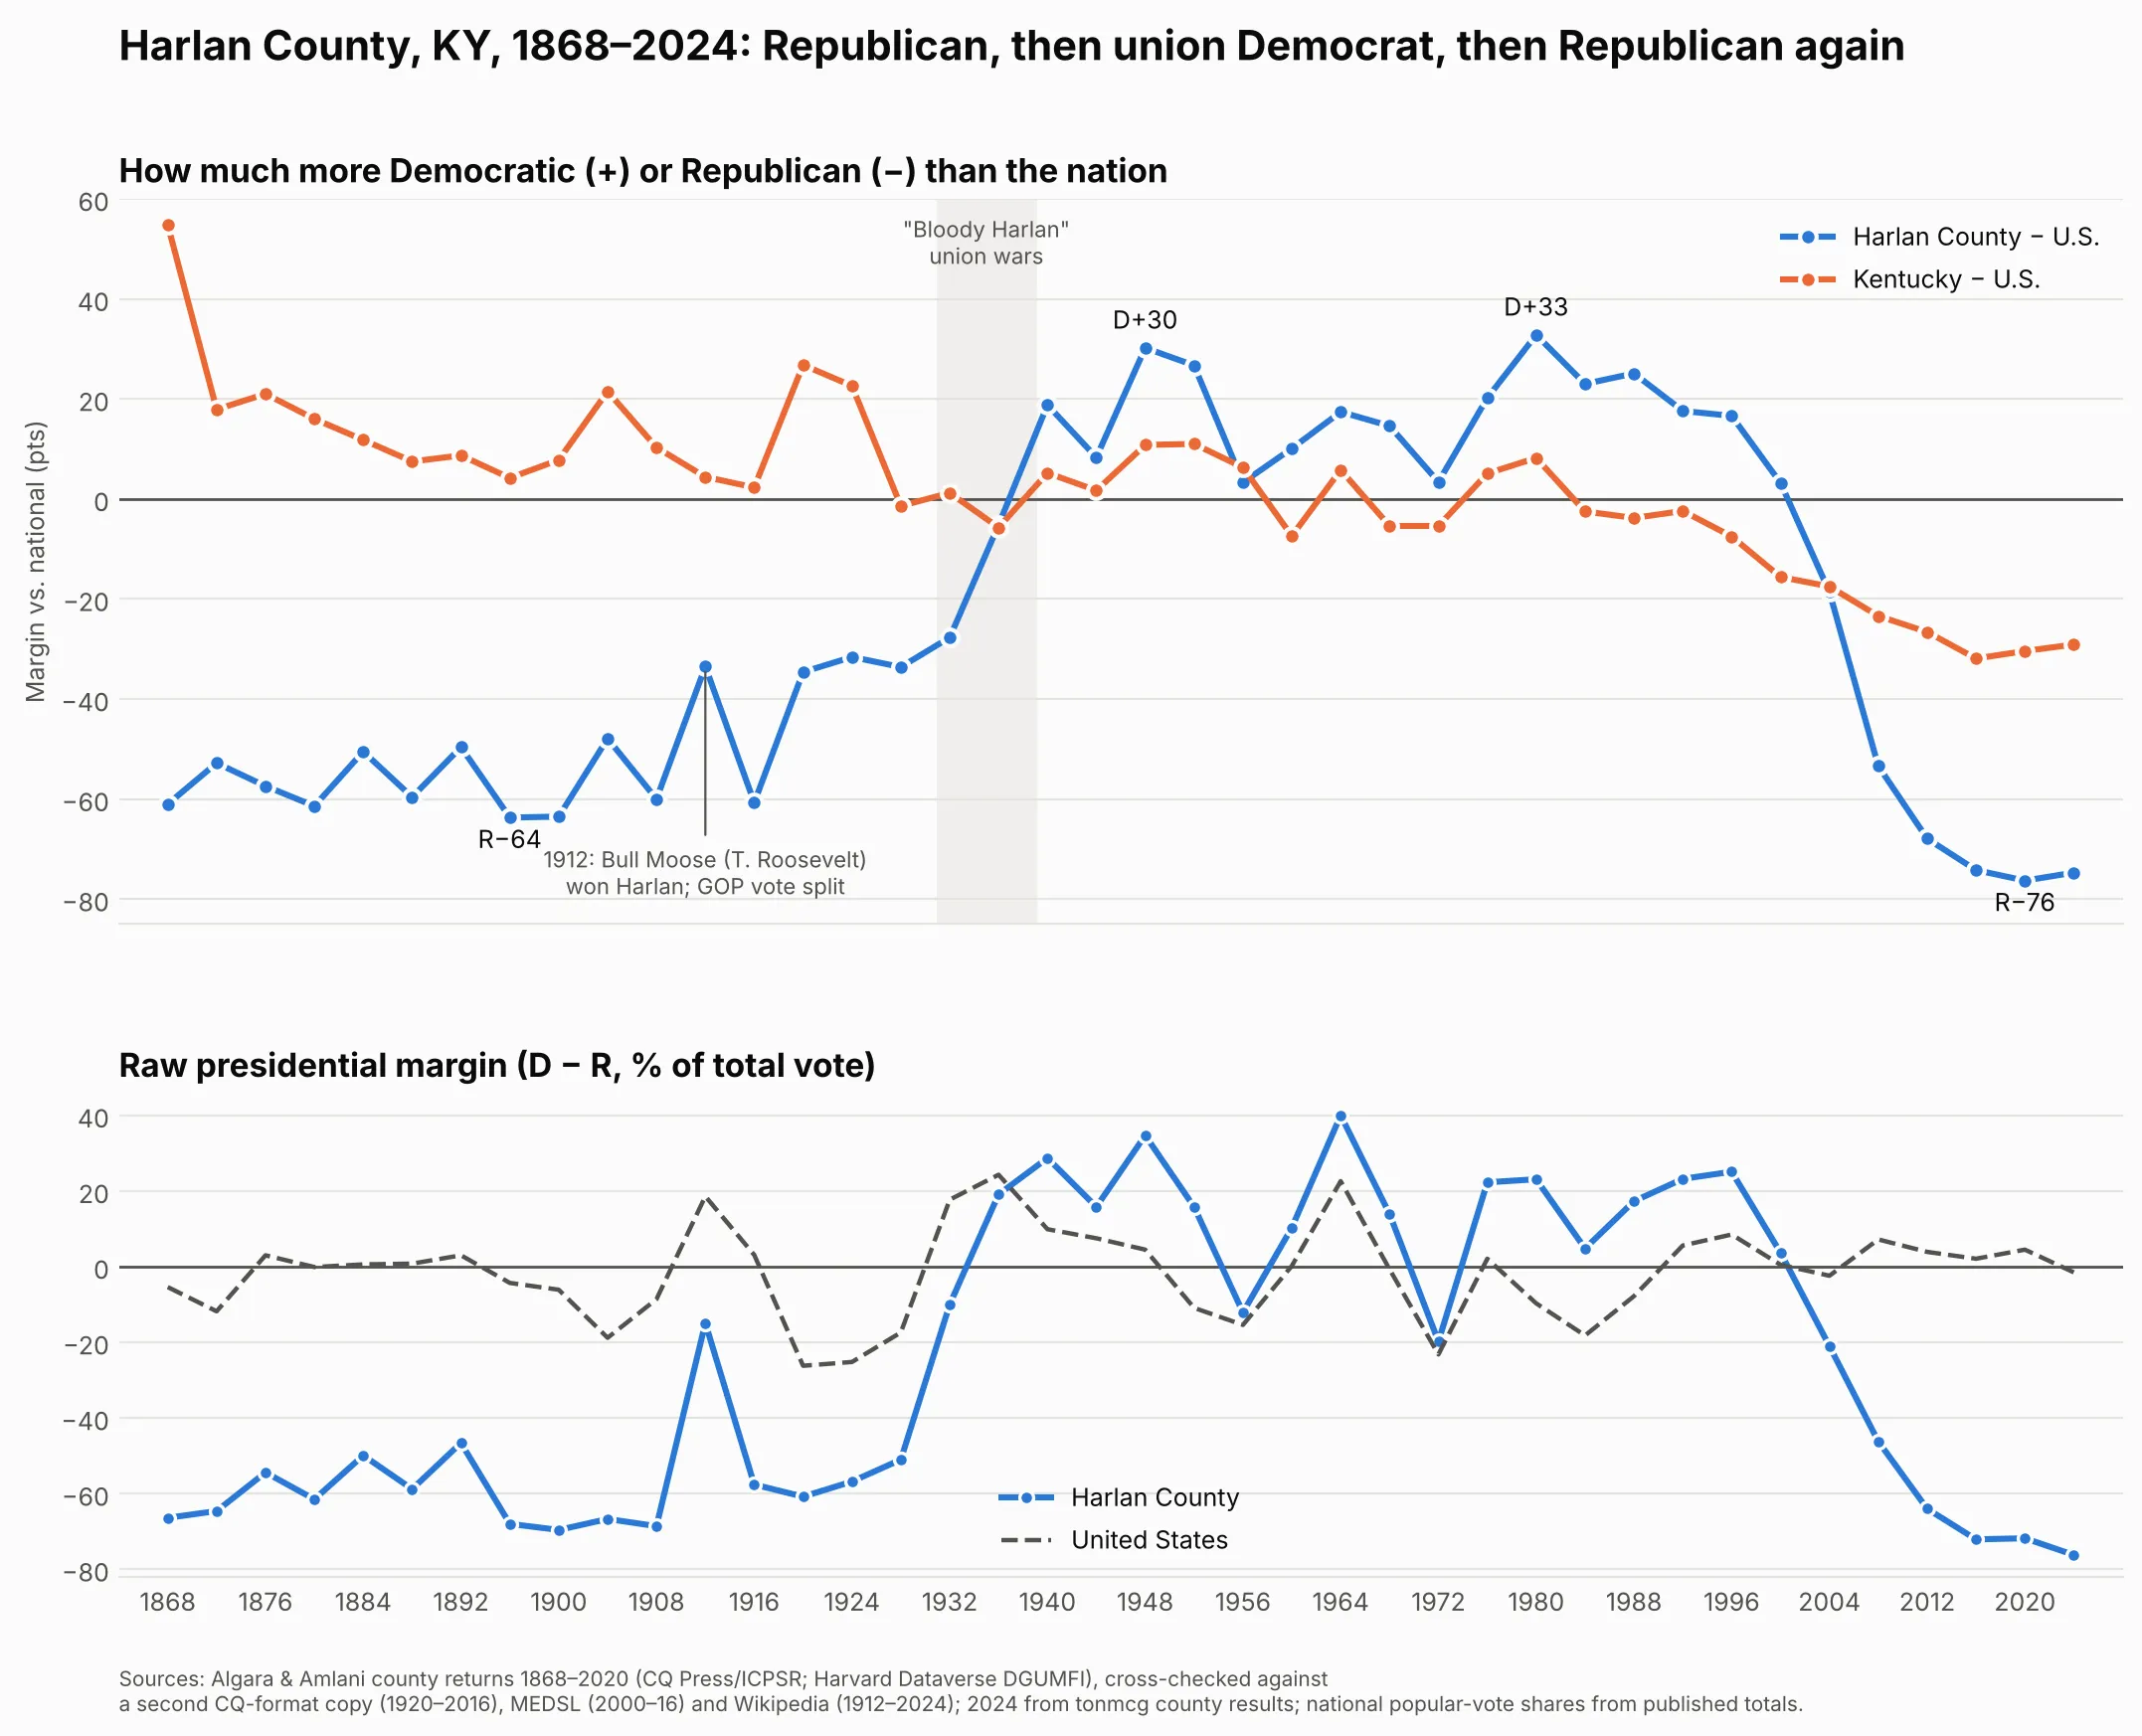
The chart below shows Harlan’s presidential margin relative to the nation: how much more Democratic (+) or Republican (−) it was than the country as a whole in each election.Wikipedia’s Harlan County page reports that Eisenhower carried the county in 1952 (10,025 to 7,284). The underlying county returns have the same numbers with the parties reversed, and they sum exactly to Kentucky’s certified 700-vote Stevenson win that year; Wikipedia’s own page on the 1952 election in Kentucky also shows Harlan for Stevenson. Harlan voted Democratic in 1952.
| Era | Harlan vs. the nation | What happened |
|---|---|---|
| 1868–1916 | R+48 to R+64 | A mountain Republican county, a legacy of Civil War-era Unionism in eastern Kentucky. Republican in every election except 1912, when Theodore Roosevelt’s Progressive ticket won it. |
| 1920–1932 | R+28 to R+35 | Still Republican as the coal boom brought in miners; Harlan voted for Hoover in 1932 (55–45) while FDR won nationally by 18. |
| 1936–1996 | about R+5, then D+3 to D+33 | The union era. Peaks at D+30 (1948) and D+33 (1980). Harlan backed Truman, Kennedy (while Kentucky went for Nixon), Carter twice, Mondale, Dukakis and Clinton twice. |
| 2000–2008 | D+3 → R+19 → R+53 | The collapse. 2004 was its first Republican vote since 1972; 2008 was the largest single-election move in the county’s history. |
| 2012–2024 | R+68 to R+76 | About as Republican, relative to the nation, as before the New Deal. |
So Harlan’s Democratic era was the exception, a roughly sixty-year departure from a Republican baseline that it has now returned to and slightly overshot.
Harlan’s economy: the union tie broke before the vote
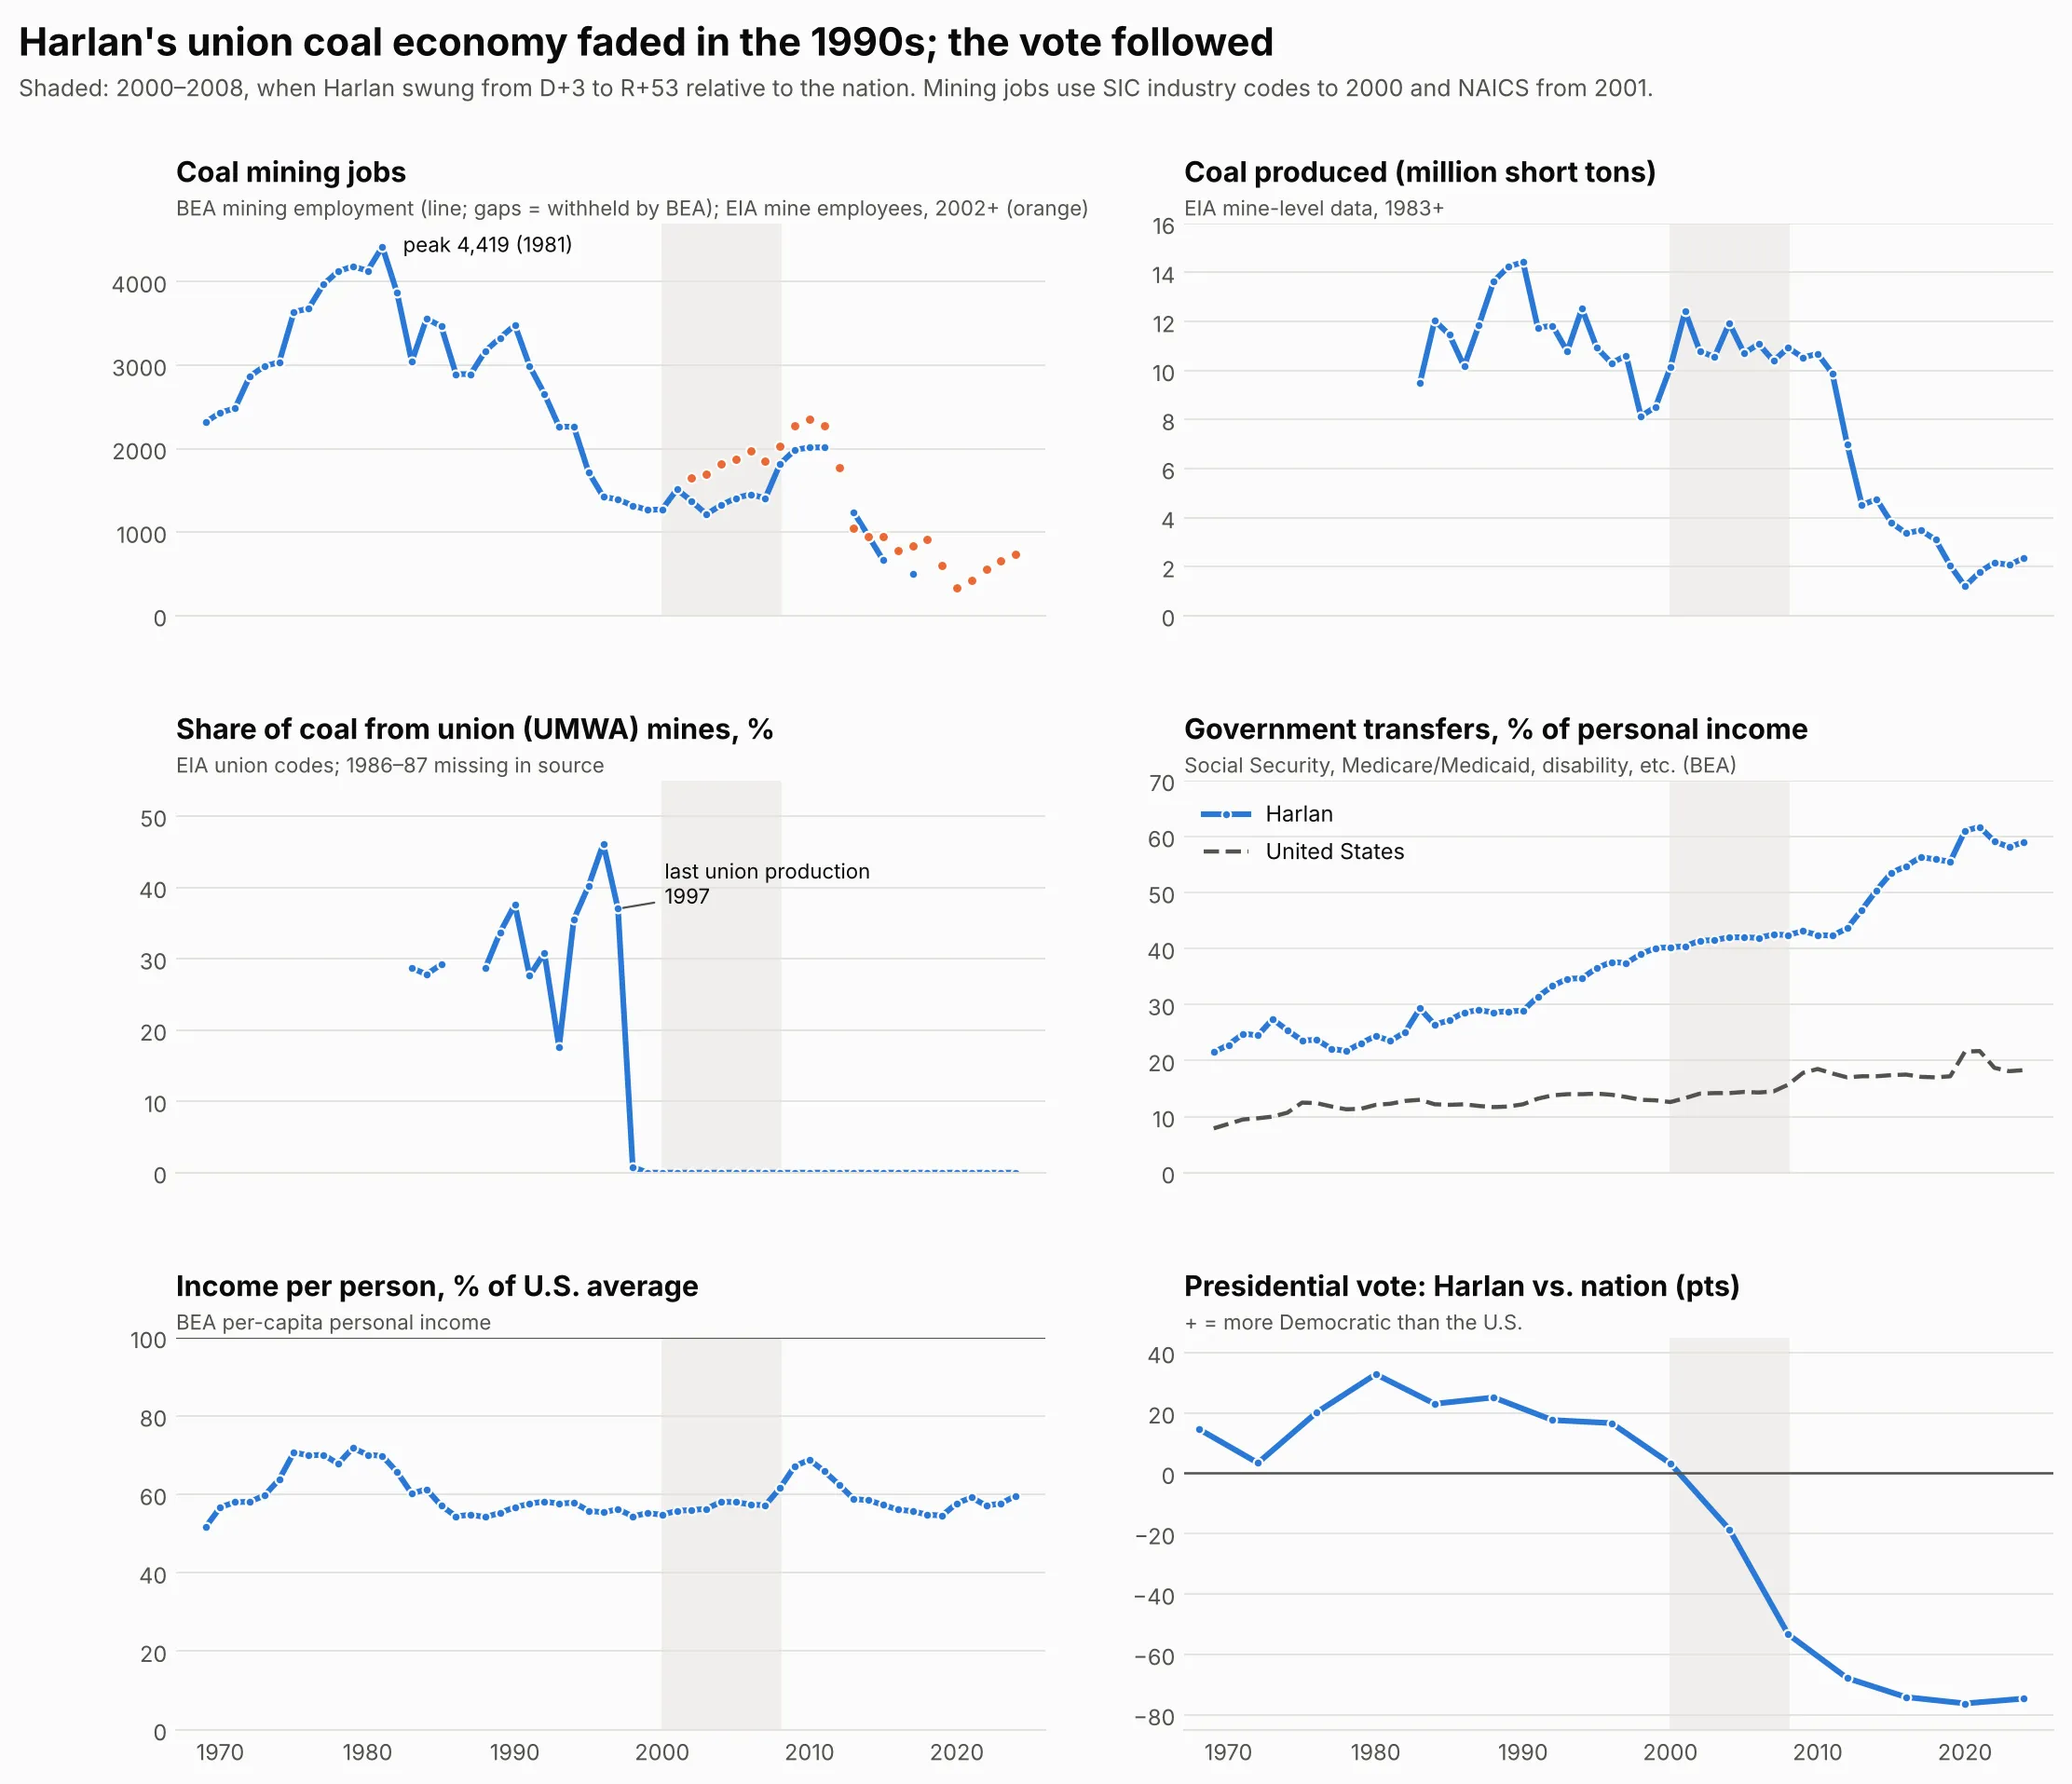
If Harlan’s Democratic loyalty rested on economics, the economy should have changed before the vote did. Mine-by-mine production records (EIA, 1983–2024) and county employment and income accounts (BEA, 1969–2024) show that it did:
| 1980 | 1990 | 2000 | 2010 | 2022 | |
|---|---|---|---|---|---|
| Mining jobs (BEA) | 4,132 | 3,480 | 1,273 | 2,015 | 580 |
| Mining share of all jobs | 32% | 29% | 13% | 19% | 7% |
| Coal produced (million tons) | 9.5 (1983) | 14.4 | 10.1 | 10.7 | 2.2 |
| Share of coal from union (UMWA) mines | 29% (1983) | 38% | 0% | 0% | 0% |
| Government transfers, % of personal income | 24% | 29% | 40% | 42% | 59% |
| Income per person, % of U.S. | 70% | 57% | 55% | 69% | 57% |
The sequence:
- In the 1990s, coal jobs fell by about two-thirds while output held steady. Mining employment peaked at about 4,400 in 1981; by 2000 it was 1,273. Mechanization and surface mining kept production around 10 million tons a year with far fewer miners.
- Union mining disappeared. About 30–46% of Harlan’s coal came from United Mine Workers mines through the mid-1990s; the last meaningful union production was in 1997, and none was recorded from 1999 on. Across Eastern Kentucky, union production had vanished by 2005.
- Then the vote collapsed (2000–2008). Notably, this happened while coal was recovering: mining jobs rose from about 1,200 in 2003 to about 2,000 in 2010. The vote did not move because coal jobs were being lost at that moment.
- The coal bust came after the political shift. Production fell from about 10 million tons in 2011 to 1.2 million in 2020. By then Harlan was already about R+68.
Meanwhile the county became heavily dependent on federal transfers (Social Security, Medicare and Medicaid, disability): from about a quarter of personal income in 1980 to about 60% by 2020, three times the national share. So the remaining economic link to Washington is through federal programs rather than union jobs, and it has not held voters the way the union did.
This is one county, and timing alone doesn’t prove cause. But the order (the union economy faded, then the vote moved, then the coal bust) fits the hypothesis that the union tie, not coal employment as such, held Harlan to the Democrats. It may also explain why Harlan flipped earlier than other coalfield counties, where union mining lasted longer.
What happened to the views themselves?
If these voters didn’t change their votes because their views changed, their views should look stable over time. Tracking the same survey questions across decades for white non-college Southerners (the closest group to Harlan that the national survey can isolate), compared with other white voters:
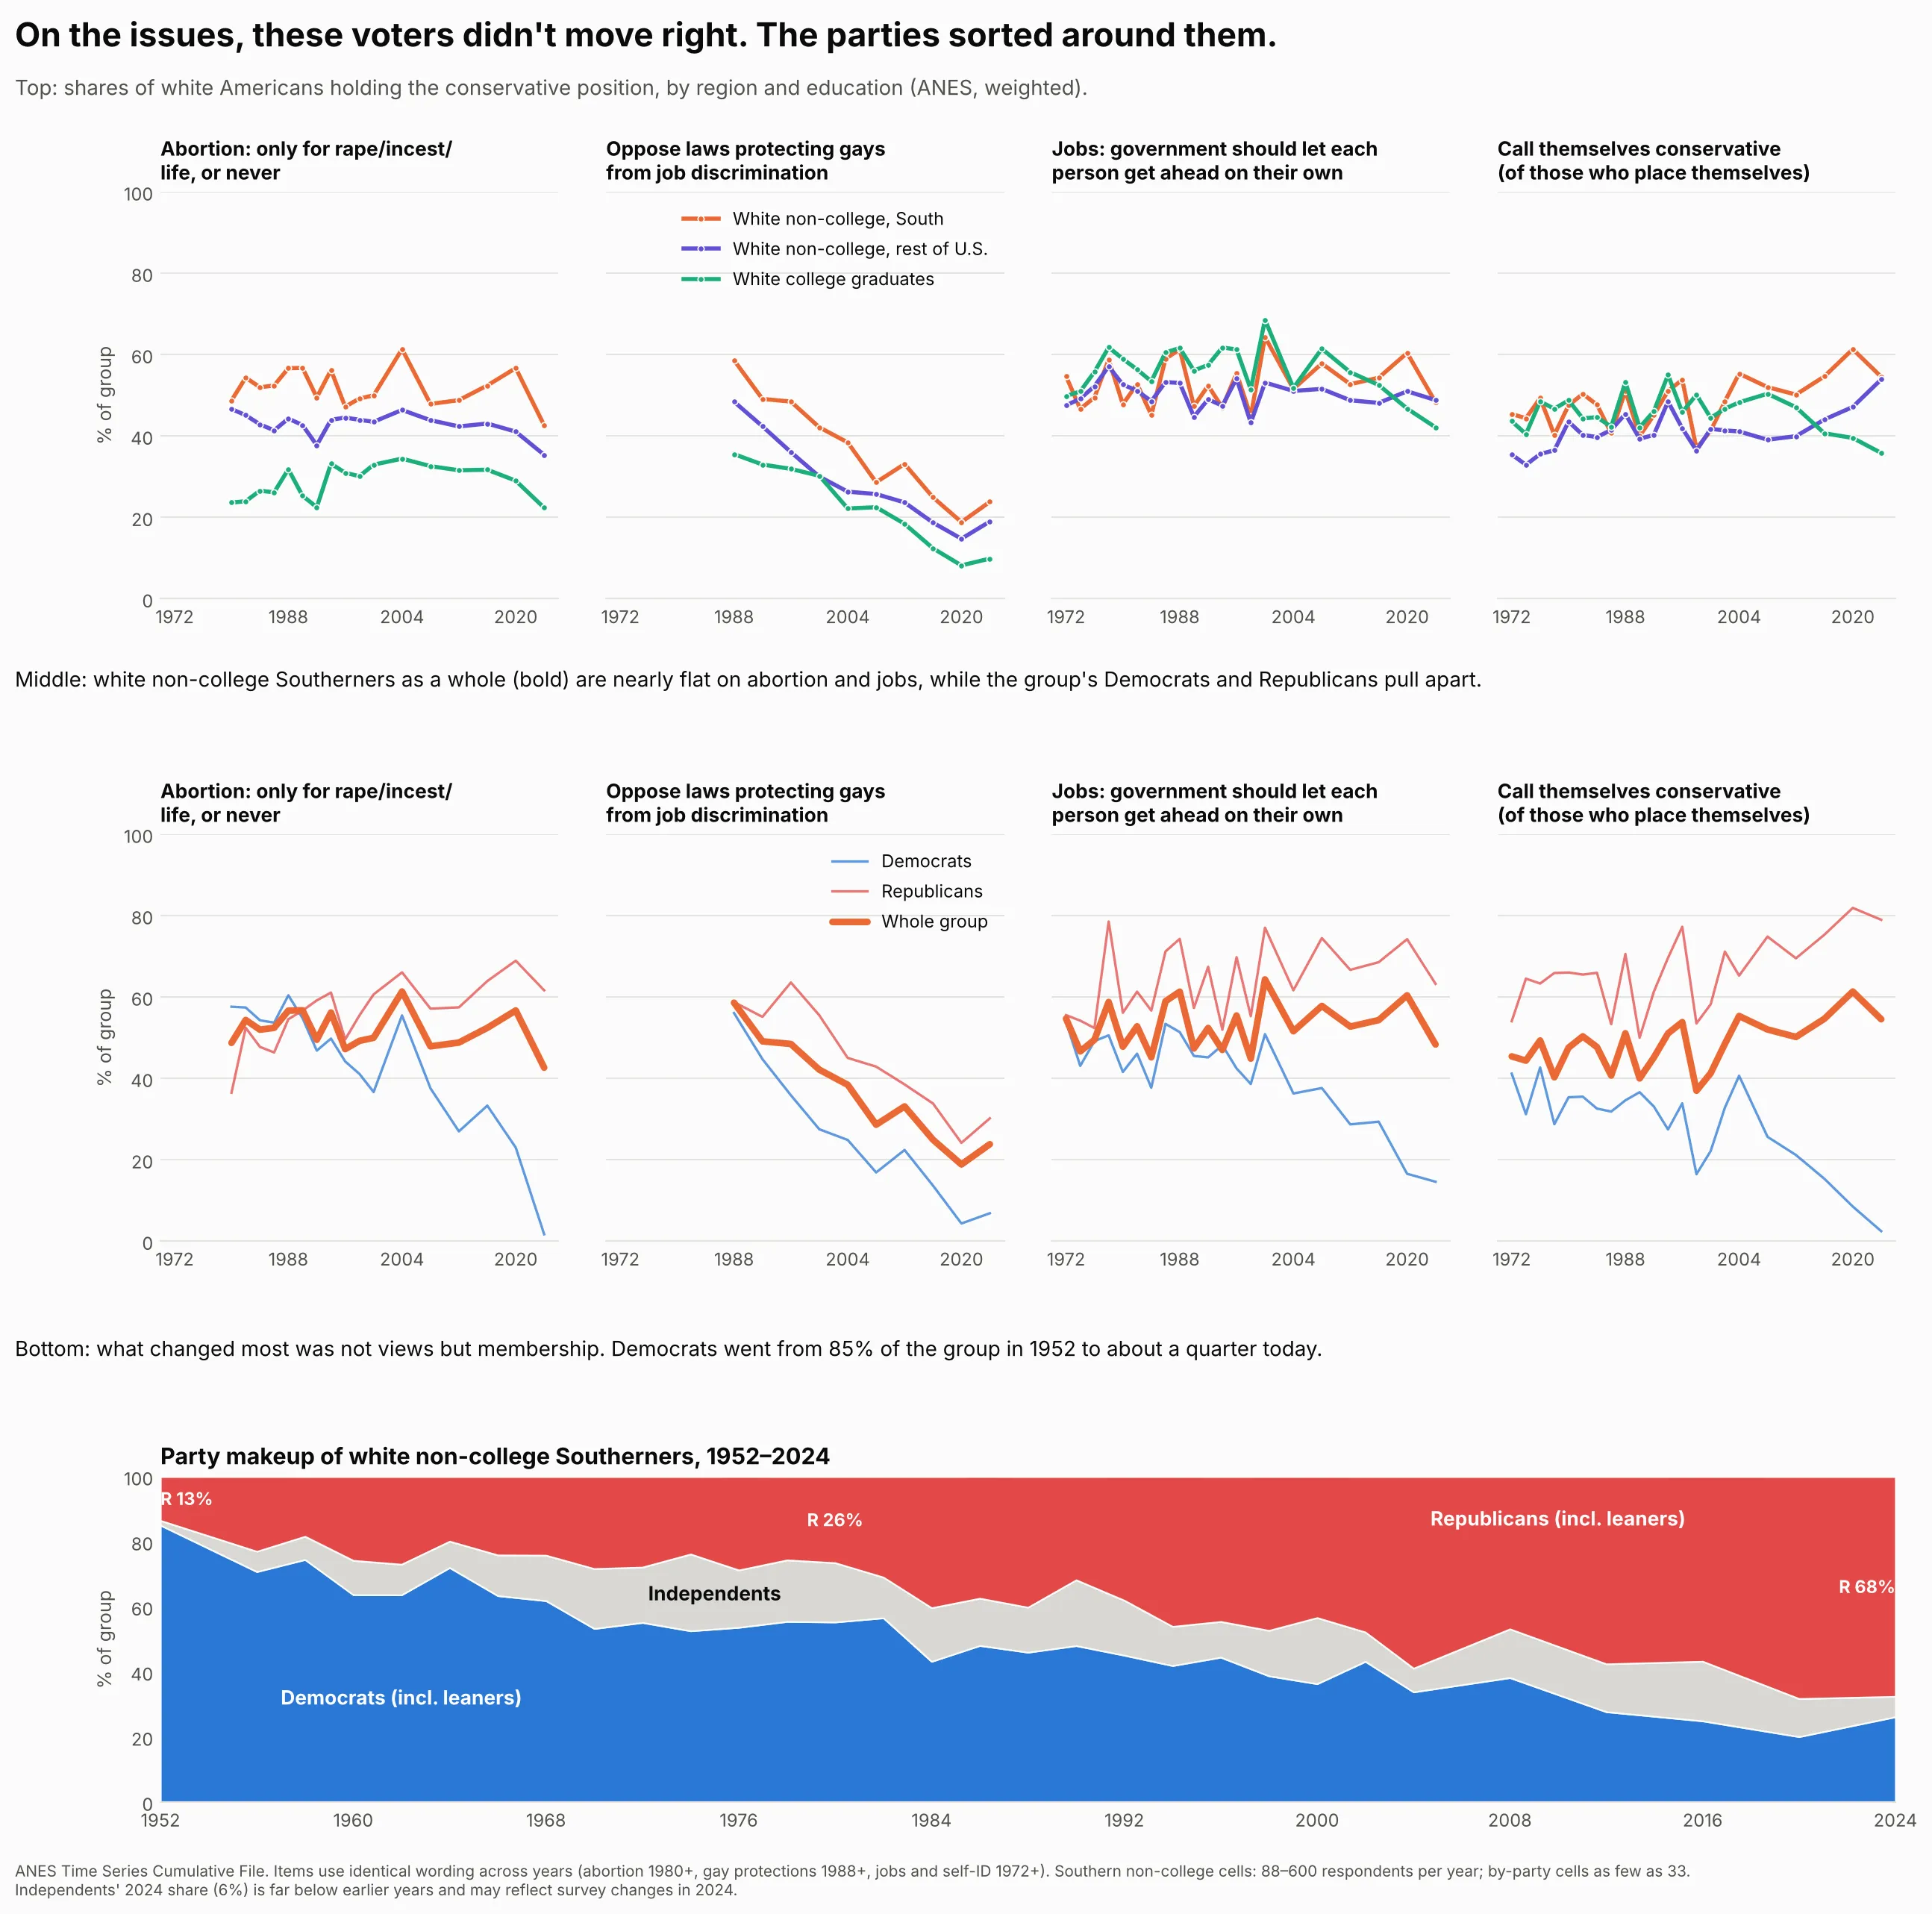
- Abortion: stable. About half of white non-college Southerners would restrict abortion to rape, incest and the woman’s life, or ban it: 49% in 1980, 47–61% through 2020, 43% in 2024 (a post-Dobbs dip seen in every group). The gap with college-educated whites (about 20–30 points) also barely changed.
- Gay rights: moved left, a lot. Opposition to laws protecting gay people from job discrimination fell from 59% (1988) to 24% (2024) in this group, about as fast as among college graduates.
- Economics: stable. The share saying government should “let each person get ahead on their own” rather than guarantee jobs bounced around 45–64% with no trend. If anything, college-educated whites moved left on this question (from about 60% to 42%).
- The label did move right. The share calling themselves conservative rose from about 45% (1972) to 55–61% (2016–2024), and among non-college whites outside the South from 35% to 54%, while it fell among college graduates. People adopted the conservative identity more than they adopted more conservative positions.
The sorting happened inside the group. In 1980, white non-college Southern Democrats were more likely than the group’s Republicans to hold restrictive views on abortion (58% vs. 36%). By 2020 the Democrats were at 23% and the Republicans at 69%. On economics, the two sides’ views were nearly identical in 1972 (54% vs. 56% “on their own”) and far apart by 2020 (17% vs. 74%). Meanwhile the group’s party makeup was transformed: Democrats (including leaners) went from 85% of white non-college Southerners in 1952 to about a quarter today, and Republicans from 13% to 68%. The group’s overall views barely changed; what changed is that people with conservative views became Republicans, leaving a smaller and more liberal Democratic remnant.
Next
In 2024, Harlan voted 88% for Donald Trump, and 58% against the Republican-backed amendment to fund private schools. Part 2 looks at the voters behind that kind of split: people who were closer to the Republicans on the issues for decades, and voted Democratic anyway.